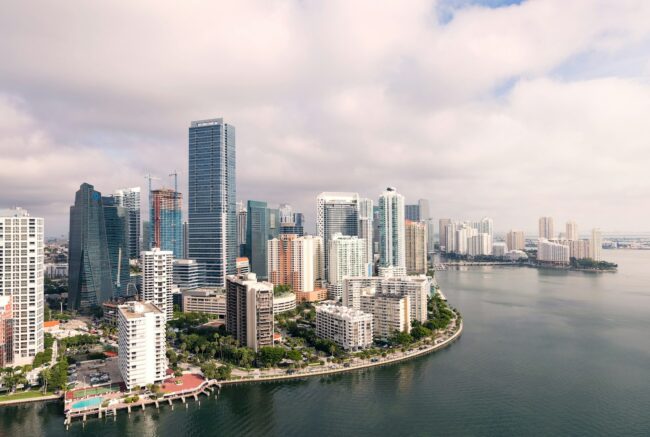
Aerial view of downtown Miami and Brickell. Source: Ryan Parker via Unsplash / License: Unsplash License
Quick Answer: In the third quarter of 2026, Palm Beach County had the lowest office vacancy of South Florida’s three big counties at 11.6%, according to Cushman & Wakefield. Miami-Dade was at 13.9% and Broward at 16.5%. All three counties absorbed space in the quarter. Most new construction is in Miami-Dade and Palm Beach. Broward has one building underway and its vacancy is expected to rise into 2027.
This analysis uses the Q3 2026 county office reports from Cushman & Wakefield (its MarketBeat series) and CBRE (its Figures series). It also draws on Lee & Associates’ South Florida Q3 2026 office report. The firms measure different sets of buildings, so their figures for the same county do not match. Compare trends within one report, not across firms.
How do the three counties compare in Q3 2026?
Cushman & Wakefield’s Q3 2026 reports put overall office vacancy at 13.9% in Miami-Dade, 16.5% in Broward and 11.6% in Palm Beach County. All three counties had positive net absorption in the quarter.
| Q3 2026 metric | Miami-Dade | Broward | Palm Beach |
|---|---|---|---|
| Inventory (sq. ft.) | 39,773,018 | 26,402,016 | 23,757,020 |
| Overall vacancy | 13.9% | 16.5% | 11.6% |
| Q3 net absorption (sq. ft.) | 151,030 | 83,904 | 74,652 |
| YTD net absorption (sq. ft.) | 604,778 | -48,475 | 278,740 |
| YTD leasing (sq. ft.) | 1,274,557 | 1,051,309 | 1,158,705 |
| Under construction (sq. ft.) | 1,844,556 | 174,790 | 1,695,144 |
| Average asking rent (per sq. ft.) | $67.77 | $45.58 | $58.05 |
| Class A asking rent (per sq. ft.) | $74.77 | $50.49 | $67.58 |
Source: Cushman & Wakefield, Miami, Fort Lauderdale and Palm Beach Office MarketBeat reports, Q3 2026. Broward’s statistics table shows $45.58; the report’s narrative says $45.59.
CBRE’s Q3 2026 Figures reports, which survey competitive Class A and B buildings of 30,000 square feet or more, show higher vacancy rates in every county, with Miami-Dade and Palm Beach nearly even and Broward highest.
| Q3 2026 metric | Miami-Dade | Broward | Palm Beach |
|---|---|---|---|
| Surveyed inventory (sq. ft.) | 38.21 million | 24.35 million | 21.86 million |
| Total vacancy | 14.5% | 18.8% | 14.6% |
| Total availability | 17.9% | 23.1% | 18.2% |
| Q3 net absorption (sq. ft.) | 85,000 | 66,000 | 39,000 |
| Q3 leasing (sq. ft.) | 849,000 | 500,000 | 726,000 |
| Under construction (sq. ft.) | 3.02 million | 177,000 | 1.74 million |
| Average direct asking rent | $70.62 full-service gross | $29.35 triple-net | $40.35 triple-net |
Source: CBRE, Miami Office, Ft. Lauderdale Office and Palm Beach County Office Figures, Q3 2026.
Why don’t the brokerage numbers match?
Each firm defines its market differently. CBRE’s Miami survey covers 38.21 million square feet, while Cushman & Wakefield tracks 39.77 million. CBRE excludes government and medical buildings, and its counts have included single-tenant buildings that are not owner-occupied since the first quarter of 2022. CBRE quotes Miami rents on a full-service gross basis, which includes operating expenses. It quotes Broward and Palm Beach rents on a triple-net basis, which excludes them. That is why its Broward rent of $29.35 looks far lower than Cushman & Wakefield’s $45.58.
Lee & Associates combines the three counties into one South Florida figure. Its Q3 2026 report shows 8.2% vacancy across 254.6 million square feet, with 376,922 square feet of net absorption over 12 months and an average triple-net asking rent of $41.90. Lee’s inventory is far larger than the two other firms’ combined, and the report reviewed does not name its data source. Its regional rate should not be set beside the county figures above.
What happened in Miami-Dade’s office market in Q3 2026?
Cushman & Wakefield reported that Miami-Dade’s overall vacancy fell 70 basis points from the prior quarter and 100 basis points from a year earlier, to 13.9%. The report called this the lowest level in six years. Class A vacancy fell 180 basis points year over year to 16.0%.
Net absorption was 151,030 square feet in the quarter and 604,778 square feet year to date. Leasing was slower. Year-to-date leasing reached about 1.27 million square feet, down 23.3% from a year earlier, and the third quarter accounted for more than 674,000 square feet of it.
CBRE’s Miami report shows a similar trend: vacancy fell 20 basis points from the prior quarter and 90 basis points from a year earlier, to 14.5%. CBRE reported 85,000 square feet of Q3 net absorption, 511,000 square feet year to date and 849,000 square feet of Q3 leasing.
How much are Miami office rents rising?
Cushman & Wakefield put Miami-Dade’s average asking rent at $67.77 per square foot, up 4.7% year over year. Class A space averaged $74.77, up 6.1%. CBRE’s average direct asking rent was $70.62 full-service gross. CBRE said that was up 2.2% from the prior quarter and 10.0% from a year earlier.
Rents vary widely by submarket. Cushman & Wakefield’s table puts Brickell Avenue at $91.52 on average and $110.57 for Class A, with 12.0% vacancy. Coral Gables averaged $65.18 with 14.1% vacancy. In the Biscayne/Wynwood/Design area, vacancy was 20.0% and asking rents averaged $83.51. Downtown Miami also had 20.0% vacancy and lost 49,285 square feet of occupancy in the quarter.
What is under construction in Miami-Dade?
Cushman & Wakefield counted 1,844,556 square feet under construction. It said this places Miami among the top five U.S. markets for office space underway. About 1.45 million square feet is in Brickell. The firm said about 24.0% of the pipeline is tied to identified users or ownership commitments, and it listed projects including Banco Santander, Mercedes-Benz Place, the Safra Bank Building and One Kane Concourse. CBRE’s survey counts 3.02 million square feet underway, including 2.945 million square feet of Class A space, and reported no Q3 deliveries.
What were Miami-Dade’s notable office deals?
CBRE listed Hut 8’s 53,000-square-foot new lease at 1100-1102 Brickell Bay Drive as the quarter’s largest new deal. Both firms recorded Banco Sabadell’s roughly 50,000-square-foot renewal at 1111 Brickell Avenue, a roughly 36,000-square-foot government lease at 8600 NW 36th Street (Cushman & Wakefield names the Miami Dade Sheriff’s Office), and QPS Miami’s roughly 34,000-square-foot lease at 2001 NW 107th Avenue.
Cushman & Wakefield reported two moves expected to affect the market. City National Bank is moving its 134,000-square-foot headquarters from Downtown to Coral Gables. Microsoft is moving its Latin America regional operations from Fort Lauderdale to 37,000 square feet at 830 Brickell.
On sales, Cushman & Wakefield recorded El-Ad National Properties’ $62.3 million purchase of 3250 Mary Street in Coconut Grove, or $775 per square foot. It also recorded the $56.9 million sale of 2525 Ponce de Leon Boulevard in Coral Gables.
How did Broward County’s office market perform in Q3 2026?
Cushman & Wakefield reported that Broward’s overall vacancy fell 30 basis points from the prior quarter, the first decline after three straight quarterly increases. At 16.5%, it was still 30 basis points higher than a year earlier.
Leasing was strong. The firm counted 392,000 square feet of Q3 deal volume, the highest quarter in two years. Year-to-date leasing topped 1.05 million square feet, up 7.2% from a year earlier. Net absorption was 83,904 square feet in the quarter, but the county remained 48,475 square feet negative year to date.
The suburbs and downtown moved in different directions. Suburban Broward absorbed 103,659 square feet, its best quarter since Q2 2024, according to Cushman & Wakefield. The Fort Lauderdale central business district lost 19,755 square feet of occupancy, and its vacancy reached 16.6%, the highest in nearly two years. The firm said BDO’s vacated downtown space was the quarter’s largest move-out. Downtown leasing still reached 270,277 square feet year to date, up 44.2% and the highest total since 2022.
CBRE’s Broward report shows 18.8% total vacancy, 23.1% availability and 66,000 square feet of Q3 net absorption. CBRE said asking rents rose 8.3% year over year.
What are Broward office rents and which submarkets are tightest?
Cushman & Wakefield reported a countywide average asking rent of $45.58 per square foot, up 7.1% year over year. Class A space in the CBD averaged $65.98, up 10.1%, and the Las Olas Corridor averaged $80.90. Suburban Broward averaged $40.04.
Vacancy varied widely across suburban submarkets. Cushman & Wakefield showed 6.6% in Pembroke Pines/Cooper City and 10.2% in Northeast Broward. Cypress Creek/Commercial was at 13.6% and Plantation at 13.7%. Sunrise was at 24.0%, Weston at 23.4% and Miramar at 22.7%.
Why could Broward vacancy rise again?
Broward has very little new construction. Both firms identify one office building underway countywide: about 175,000 square feet at FAT Village in downtown Fort Lauderdale. Cushman & Wakefield said the building was due to deliver by year-end with more than 76% of its space vacant. The firm also said the former Spirit Airlines headquarters could come back on the market, potentially adding more than 250,000 square feet. It expects vacancy to trend upward into 2027.
Among Broward deals, CBRE listed HCFS (36,000 square feet) and Venture X (25,000 square feet) in Sawgrass Park, and GXO Logistics’ 35,000-square-foot lease at 501 North Andrews Avenue downtown. In the largest sale, both Cushman & Wakefield and Lee & Associates recorded Mana Group’s $89.0 million purchase of 110 SE 6th Street, a 394,830-square-foot Class A tower, from IP Capital Partners.
Why is Palm Beach County’s office market the tightest?
Cushman & Wakefield put Palm Beach County’s overall vacancy at 11.6%, down 100 basis points year over year and the lowest in two years. The West Palm Beach CBD was at 12.2%. The report said that if recently leased buildings are counted as occupied, the effective vacancy rate is closer to 8.5%. Net absorption was positive for a third straight quarter, reaching 74,652 square feet in Q3 and 278,740 square feet year to date.
CBRE’s survey put countywide vacancy at 14.6% and availability at 18.2%, with 39,000 square feet of Q3 net absorption. It counted 726,000 square feet of Q3 leasing and about 1.8 million square feet year to date. CBRE said Class A direct vacancy in the West Palm Beach CBD was 12.4%. It noted that this rate is inflated by a large block at 300 Banyan that is leased but not yet occupied.
How high are Palm Beach office rents?
Palm Beach County’s rents rose fastest of the three counties. Cushman & Wakefield reported a countywide average of $58.05 per square foot, up 12.3% year over year, and a suburban average of $51.63. In the West Palm Beach CBD, average asking rents reached $98.13, up 15.4% year over year but down 3.0% from the prior quarter. Class A CBD space averaged $117.77. CBRE’s countywide average direct asking rent was $40.35 triple-net.
What deals defined Palm Beach County’s quarter?
Fiserv’s lease of about 254,000 square feet at 4700 Exchange Court, part of the Boca Raton Innovation Campus, was the quarter’s largest deal. Cushman & Wakefield called it the county’s biggest lease since 2023. CBRE described it as a 250,000-square-foot commitment and the largest South Florida office lease since 2020. Cushman & Wakefield said Northwest Boca Raton accounted for about 36.0% of the county’s 2026 deal activity.
In West Palm Beach, 15 CityPlace recorded nearly 75,000 square feet of preleasing in Q3, according to Cushman & Wakefield, including about 25,000 square feet each for CDM Smith and Greenberg Traurig. ServiceNow leased 21,160 square feet at 525 Okeechobee Boulevard.
On sales, Cushman & Wakefield listed the 1,781,645-square-foot Boca Raton Innovation Campus as sold by DRA Advisors to Related Ross, at an undisclosed price. Thor Equities bought 5355 Town Center Road in Boca Raton from CP Group for $62.0 million, about $407 per square foot. Both Cushman & Wakefield and Lee & Associates recorded that sale.
What is in Palm Beach County’s construction pipeline?
Cushman & Wakefield counted 1,695,144 square feet in the development pipeline. That includes The Modern, a 200,000-square-foot project scheduled for delivery in late 2027, and One West Palm. The firm said One Flagler and 300 Banyan, both delivered at the end of 2024, are now fully leased. CBRE counted 1.74 million square feet under construction and reported one Q3 delivery: 79,000 square feet at Sundy Village in Delray Beach.
What does the Q3 2026 data mean for South Florida tenants and owners?
The reports point to three different conditions. Miami-Dade has falling vacancy, steady absorption and the region’s largest pipeline. Palm Beach County has the lowest vacancy and the fastest rent growth, and much of its new space is already leased. Broward has rising leasing activity, but empty downtown space and a mostly vacant new building on the way are expected to push vacancy higher into 2027.
Frequently Asked Questions
Which South Florida county had the lowest office vacancy in Q3 2026?
Palm Beach County, at 11.6%, according to Cushman & Wakefield’s Q3 2026 MarketBeat. Miami-Dade was at 13.9% and Broward at 16.5%. CBRE’s surveys put Miami-Dade at 14.5%, Palm Beach at 14.6% and Broward at 18.8%.
What is the average office asking rent in Miami-Dade?
Cushman & Wakefield reported $67.77 per square foot in Q3 2026, up 4.7% year over year. CBRE reported an average direct asking rent of $70.62 full-service gross.
What was the largest South Florida office lease in Q3 2026?
Fiserv’s lease of roughly 250,000 to 254,000 square feet at 4700 Exchange Court in Boca Raton. CBRE called it the largest South Florida office lease since 2020.
How much office space is under construction in South Florida?
Cushman & Wakefield counted about 1.84 million square feet in Miami-Dade, about 1.70 million in Palm Beach County and 174,790 in Broward. CBRE’s surveys show 3.02 million, 1.74 million and 177,000 square feet. Lee & Associates reported 6.46 million square feet regionwide under its own definitions.
Why do Cushman & Wakefield and CBRE report different vacancy rates?
They survey different sets of buildings. CBRE counts competitive Class A and B buildings of 30,000 square feet or more and excludes government and medical buildings. Rent bases also differ.
Sources and Further Reading
- Miami Office MarketBeat, Q3 2026 — Cushman & Wakefield
- Fort Lauderdale Office MarketBeat, Q3 2026 — Cushman & Wakefield
- Palm Beach Office MarketBeat, Q3 2026 — Cushman & Wakefield
- Miami Office Figures, Q3 2026 — CBRE
- Ft. Lauderdale Office Figures, Q3 2026 — CBRE
- Palm Beach County Office Figures, Q3 2026 — CBRE
- South Florida Office Market Report, Q3 2026 — Lee & Associates
About Brian French
Led by a commitment to tech-intelligent curation, Brian French tracks and analyzes the Business News in South Florida including corporate developments defining Florida's economy. Brian brings an extensive financial background to his analysis, having graduated from the University of South Florida in Finance and serving as a Vice President and Portfolio Manager for Merrill Lynch Private Investors and the Trust Department in St. Petersburg, FL, as well as a Vice President and Trust Investment Officer for SunTrust Bank in Sarasota, FL. His writing blends macroeconomic trends, capital markets, corporate strategy, and modern digital insights for a sophisticated look at Florida's dynamic business economy.